


The United Nations works to advance the 17 Sustainable Development Goals (SDGs) by 2030. The 17 SDGs were designed not as separate and isolated goals, but as a network, in which links among the goals exist through targets and indicators that refer to multiple goals. The project team from Columbia University’s Quantitative Methods in Social Science MA course worked to develop a model that could define and measure linkages and networks of SDG and see how much SDG linkages and, or networks progress over time.
Research Set-Up
Rather than choosing every single indicator to assess the goals being met, we decided to pick two countries to undergo a micro-level analysis. Indonesia (Asia) and Guatemala (Central America) are selected for this study because of their similarity in population density, and political system. These two democratic nations are located in Asia and Central America, providing an opportunity to compare and contrast the integration and network effect of SDGs between nations on different continents.
Text-Based Model & Findings
Two methodologies are incorporated throughout the research. One is a text-based model using Natural Language Processing method. The purpose was to find the connections among indicators by looking at the text-similarity of each indicator’s definition. The definitions are extracted from SDG indicator metadata repository provided by UN Department of Economics and Social Affairs, and there are 246 definitions in total.
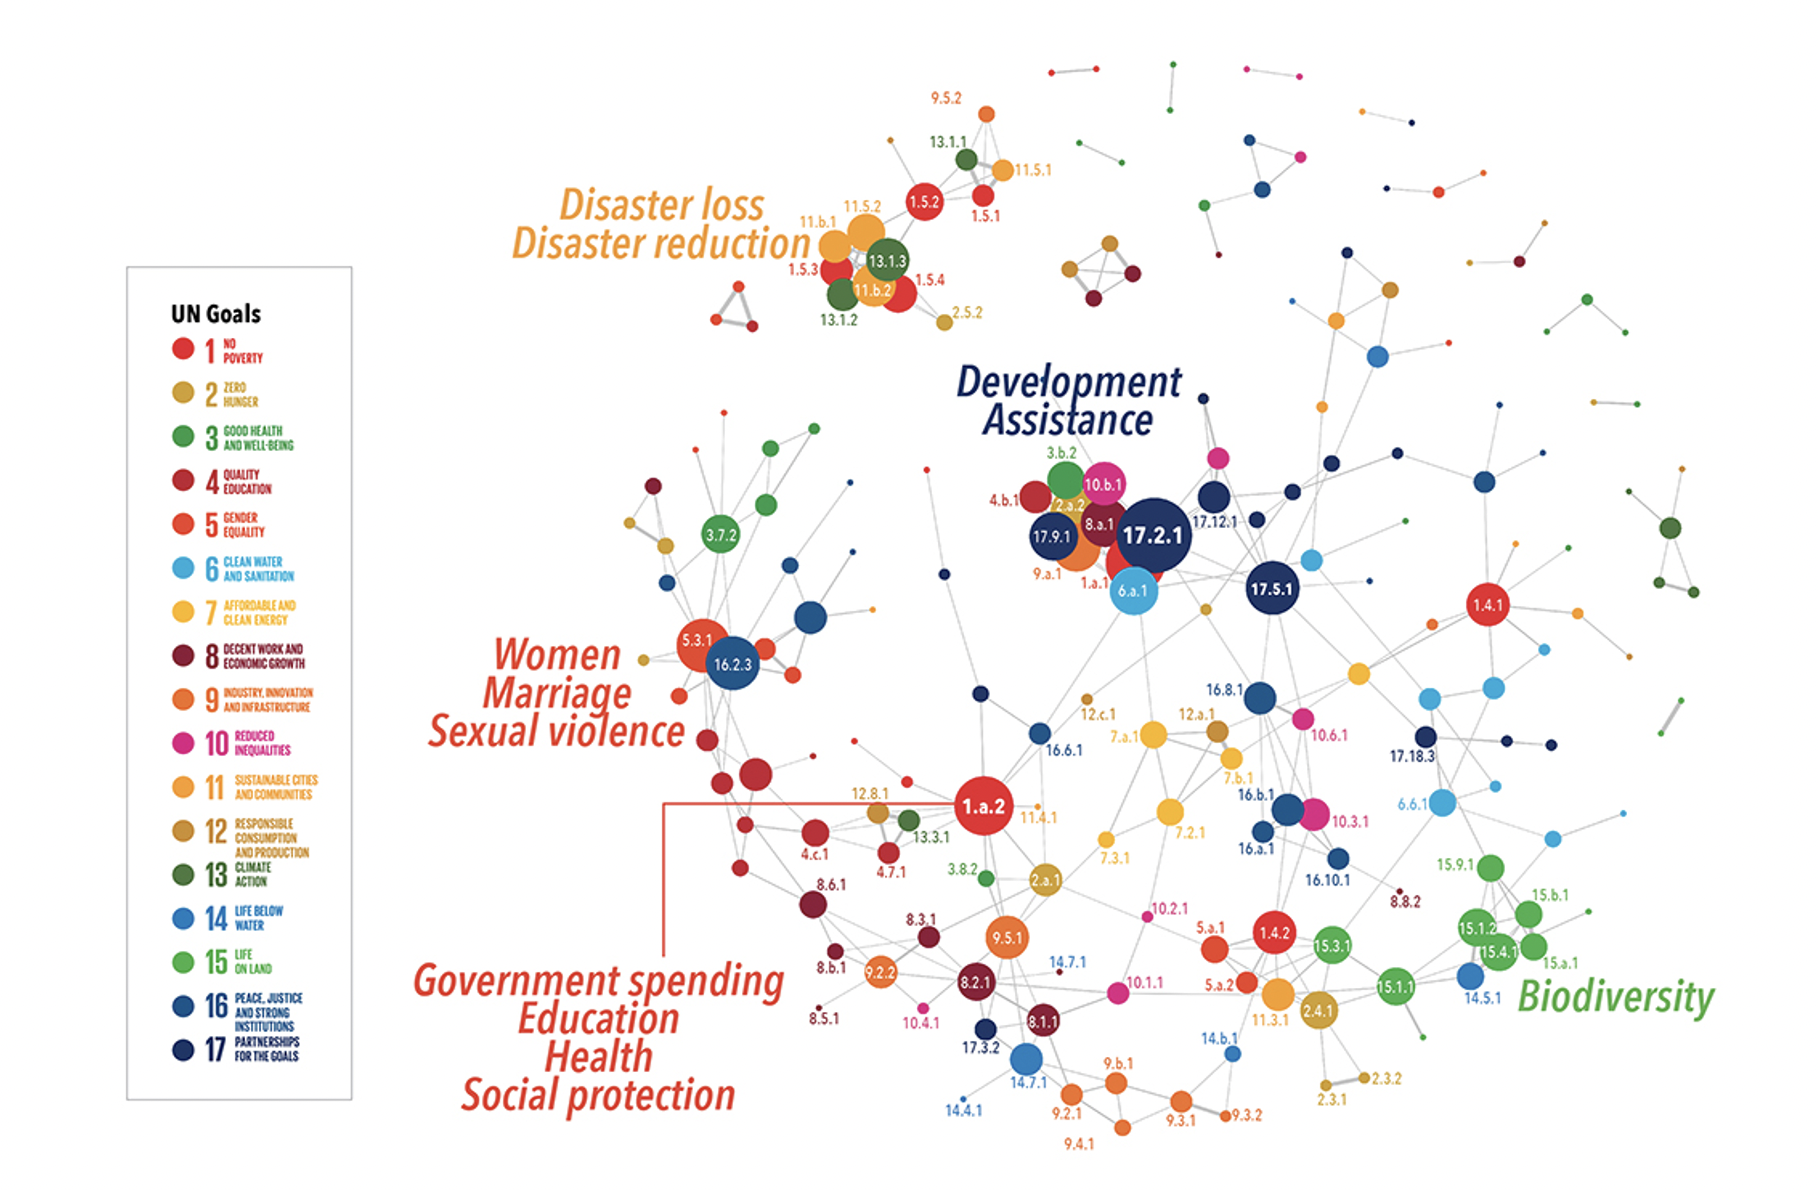
For the final output, indicators with a similarity score higher than 0.2 are chosen. Findings show that indicator 17.2.1 is the most central one, with 14 links to other indicators. Those indicators of high centrality, such as 17.2.1, 1.a.1, 1.a.2, 5.3.1, 16.2.3, 17.5.1 (linked to 10 or more other indicators), could also potentially be the priority of investment since they are linked to a larger number of other indicators and the investment in one might bring multiple returns.
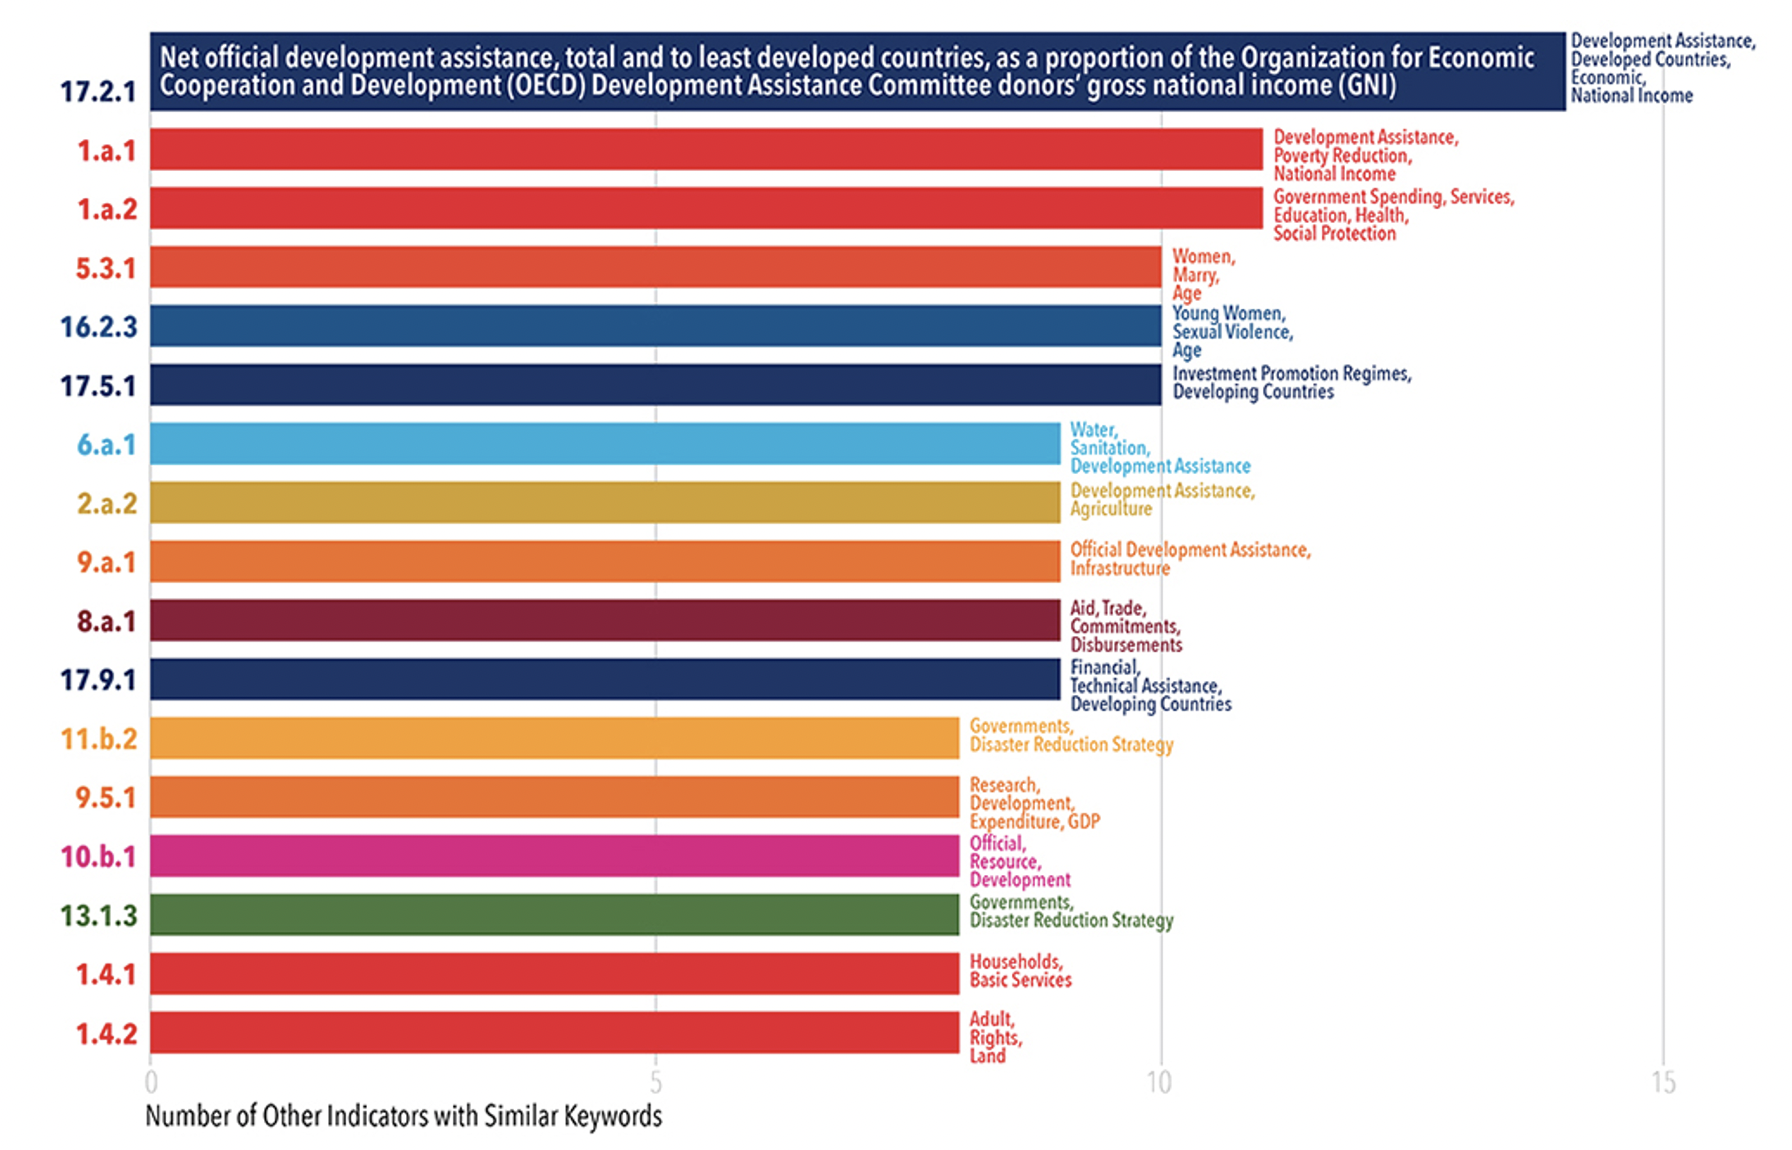
From the bigger picture of the network, several noticeable clusters show how indicators relate to other indicators from a different goal, and the common topic conveyed. For instance, a cluster with indicators of high centrality could be seen with indicators 17.2.1, 8.a.1, 10.b, representing the topic of Development & Assistance. Besides Development & Assistance, the topic of Education, Health and Social Protection is spread out from 1.a.2. There are also noticeable clusters with topics of Biodiversity and Disaster Reduction; Gender-Related topics are also frequently mentioned across different indicators. Those clusters could also be potential investment focus because again the investment in one might bring multiple returns.
Social Network Model & Findings
The second model used during the research is a social network model, which extracts data from the UN SDG Indicators Database. The data is composed with a hierarchical structure, where there are multiple targets under each goal, multiple indicators under each target, and multiple measurements under each indicator, as a result after the removal of disaggregated measurements.
In the outcome of Indicators are presented as nodes and correlation relationships between indicators as ties that bridge between two nodes. Correlation coefficients are considered as tie weights.
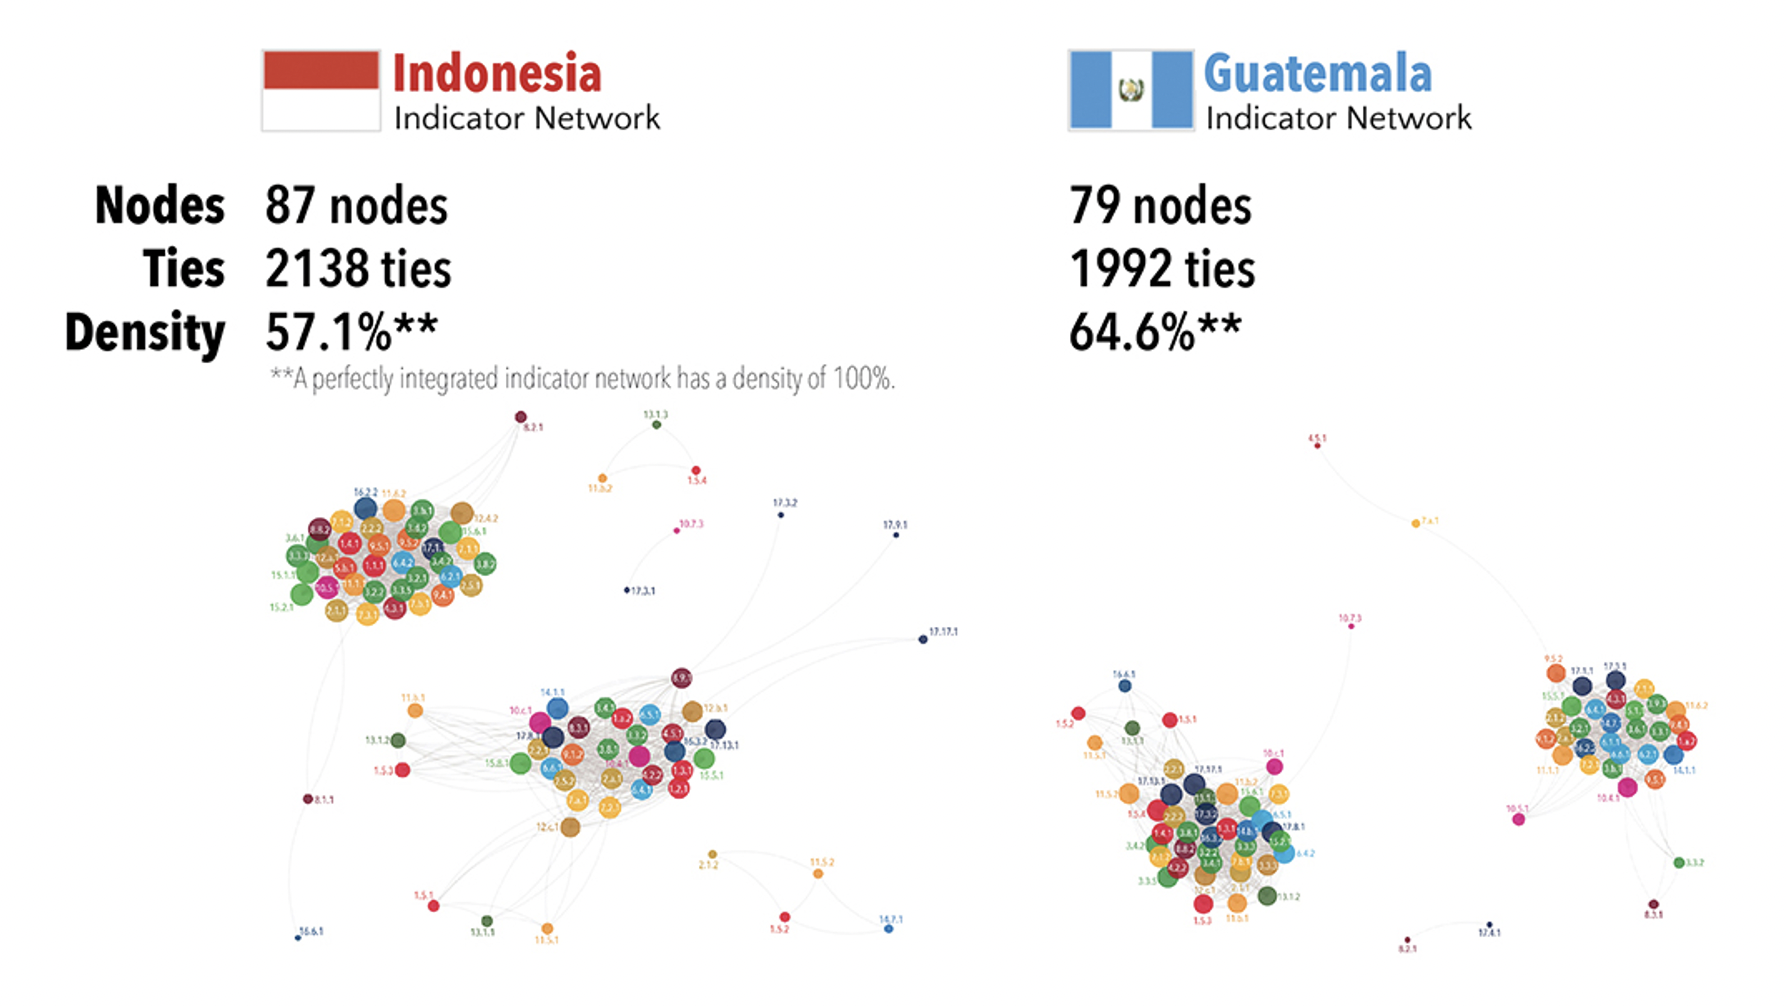
After conducting the analysis, 87 nodes were used for Indonesia with a total of 2,138 ties. The density level was at 57.1%. For Guatemala, 1,992 ties were formed with 79 nodes with a density of 64.6%. Both networks are consisted of two major clusters.
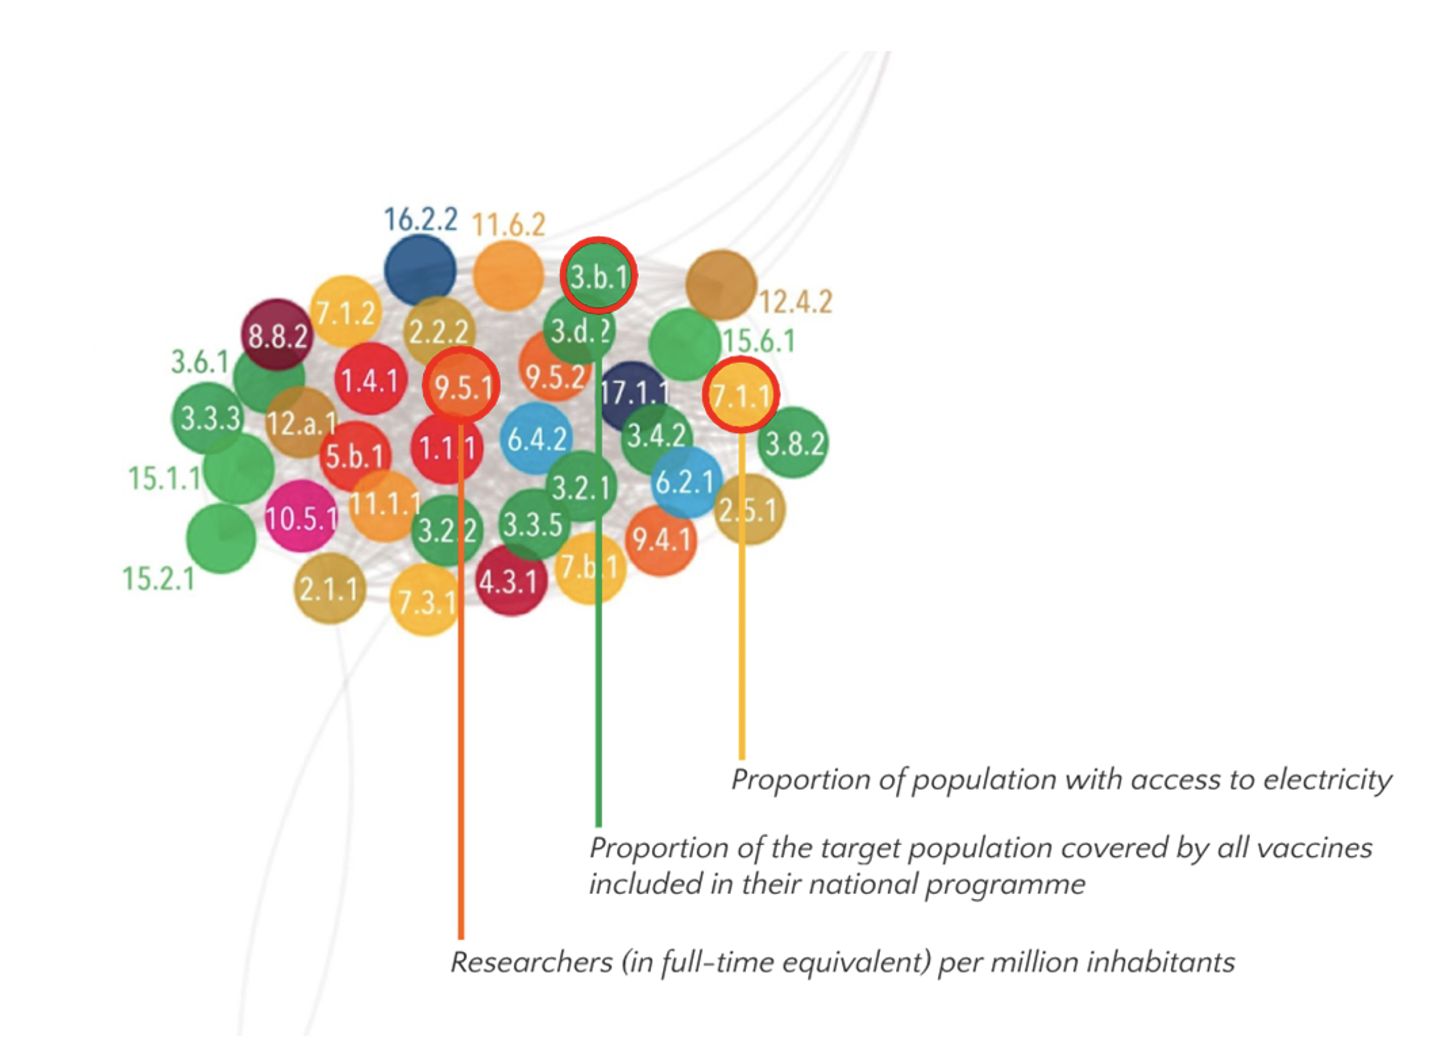
In a network, a positive correlation implies that when an indicator is invested, its effort will likely bring positive effect to neighboring indicators in the network, and vice versa. As an example, we took a closer look at one of the clusters in the Indonesia’s positive network, which has higher levels of focus on issues related to urbanization, infrastructures, research and technological development, and agricultural development and issues around human access to clean food, water, and air.
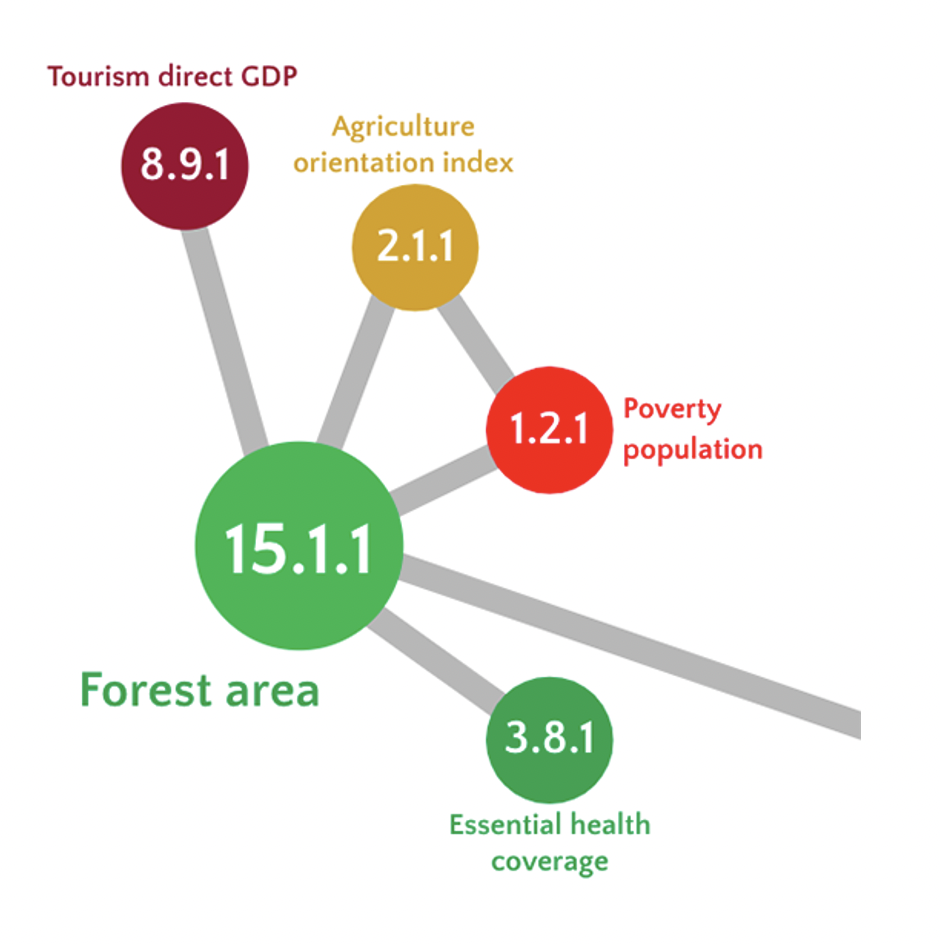
However, while attentions are often drawn to the positive relationship between indicators that are value-adding to each other, it is also important to consider the negative correlation that may reverse the efforts of neighboring indicators. Although they may not seem related at all, when there is a negative correlation, it implies that when an indicator is invested, its effort will likely bring negative effect to neighboring indicators in the network.
Lastly, we also found out from the research that while the clusters have dozens of indicators, it is difficult to identify any particularly central indicators. Indicators with significant ties to other indicators tend to be relatively consistent in terms of centrality level within their clusters. For example, when looking at the clusters, it can be seen that each cluster has a connection available.
The study also aimed to find the similarity between text network and coefficient network structures. An assumption was made prior to the analysis that text similarity is adequately reflecting the actual indicator network structure. However, the results showed that for both countries, the relationship between the coefficient network and text network is not statistically significant, meaning that it was not be reliable.
What next?
Although many linkages were found through this research, future research should look at more countries to test the generalizability of the coefficient network. Another suggestion made was to conduct a time series analysis to exclude serial correlation issues. This will allow to minimize any data duplication and misinterpreted data. Previously, research showed that the indicator network structure is similar to some extent, but it was not clearly consistent across countries. Thus, more network analysis should be conducted to see if a stable correlation exists.
Authors: Qinyue Hao, Jasmine Hwang, Dan Li, Peishan Li, Rina Shin, Connie Xu, Hanyu Zhang, Zinwen Huang, Cara Latinazo, Xingchen Li, Soobin Oh, Lizabeth Singh, Mengying Xu, Tianqing Zhou